Comprehensive Analysis of Pharmacy Operations and Patient Outcomes
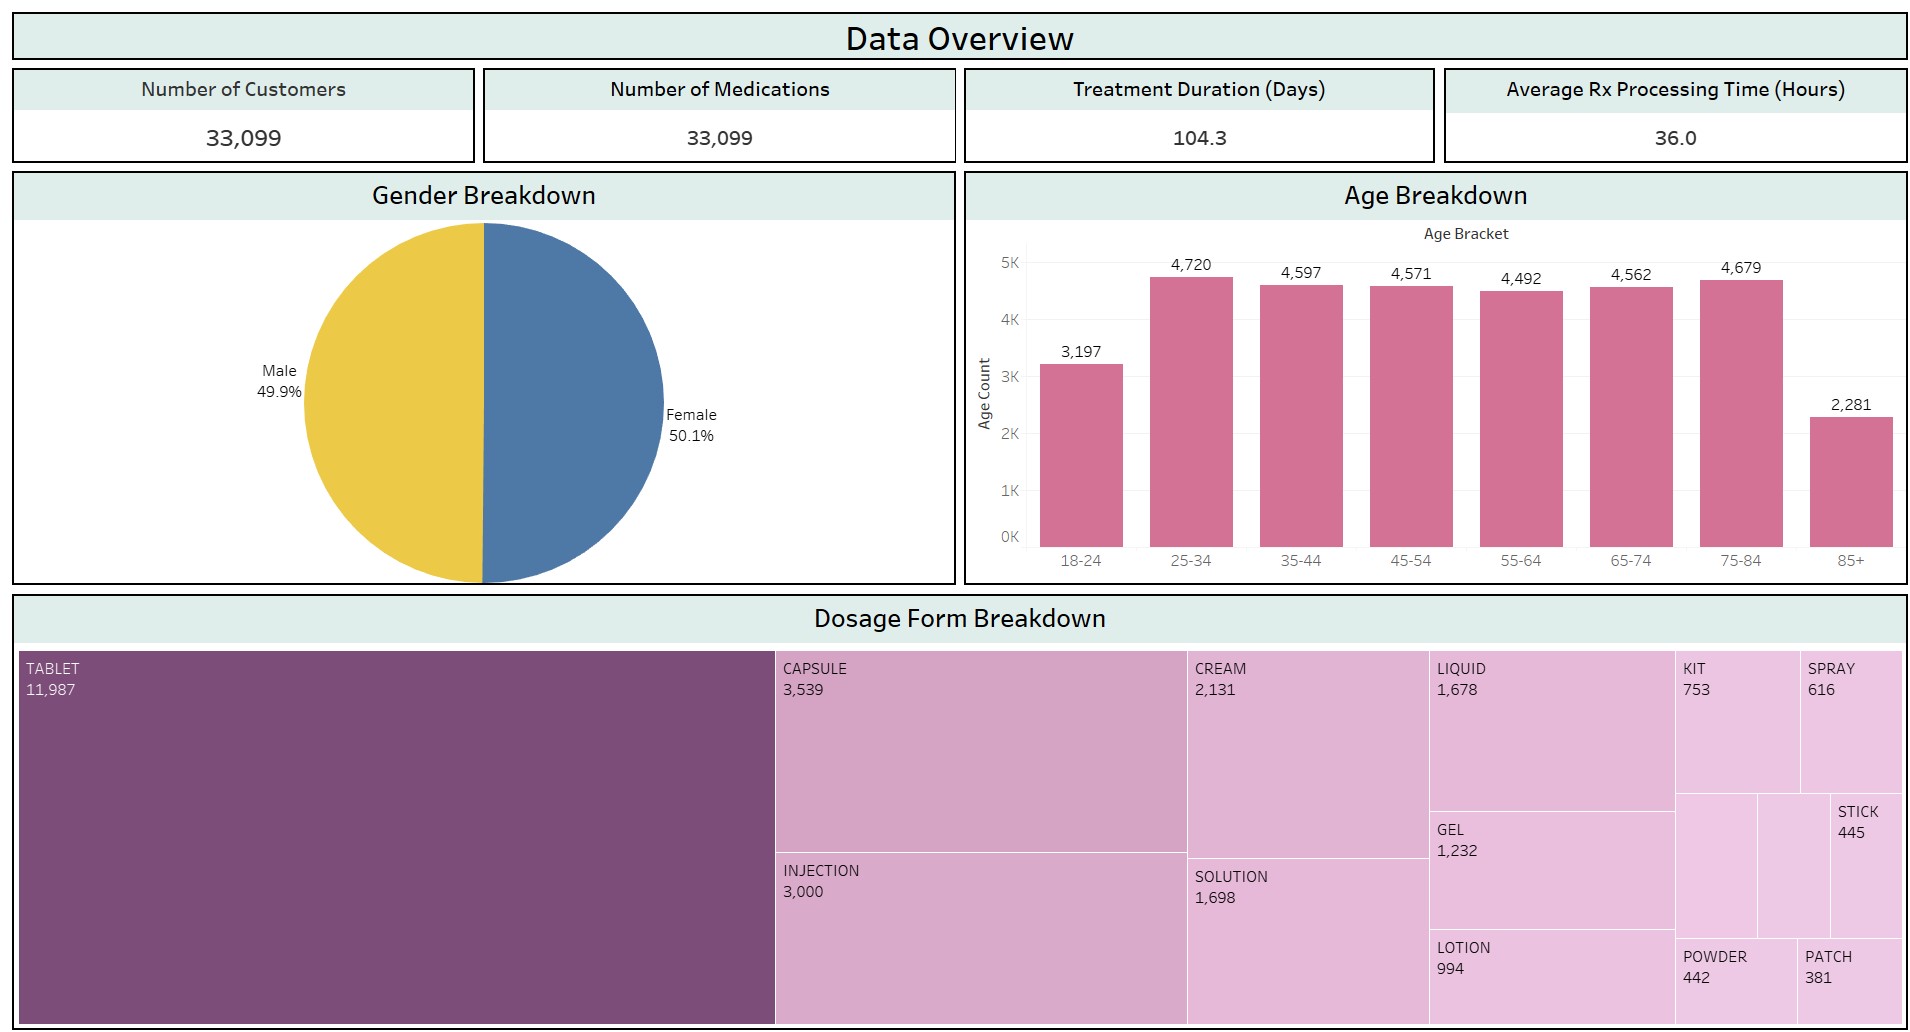
In this study, I conducted analysis of hospital pharmacy operations and their impact on patient outcomes. By utilizing a program-generated dataset with patient demographics, medication details (including NDC Code), adherence rates, and pain management outcomes, I aim to uncover insights that could optimize pharmacy processes and improve patient care. All medication data was downloaded from the FDA website here. All customer demographic and temporal data was generated using Faker, a Python library. Please note this data does not reflect actual customer data or medication data. Key findings and recommendations are entirely hypothetical. Data spans February 1, 2024 - September 18, 2024. Please view the Tableau dashboard here.